

I recently wrote about the TJS-4 satellite, which the Chinese put into geostationary orbit. Based on the picture released during launch, I concluded it was a signal intelligence satellite, capable of collecting signals of “250MHz to 1.5GHz of frequency. It is even possible that smaller elements, not visible on the image, allow the satellite to go up to the upper limit of the S band, at 4GHz”.
Based on the configuration of its antenna array, I also speculated it “probably enables it to very quickly localize the emitters it is listening to”.

An inquisitive Chinese reader of this site has found an interesting 2009 research article, which describes the “Design and realization of a spaceborne dual-circular-polarization multi-beam log-periodic dipole antenna array”. While this very technical title might sound a bit confusing, the pictures in the article speak for themselves:
The article is actually describing the antenna array of TJS-4, or at least an early design iteration. The introductions states “The antenna forms multiple beams to cover the ground in a specific manner, and completes the function of collecting ground wave signals and locating source targets” and “in order to create a signal reception from the ultra-short-wave radio to the cellular communication band (0.2-2.5 GHz), the unit’s operating band is required to be wide”. So my estimate of 250MHz to 1.5GHz, with a possibility of going to 4GHz with elements not visible in the original pictures was no too far off. It’s very good for the low end and not very good at the high end.
Actually, the paper explains how the high frequency is reached. The 4 large antenna elements only cover the 200MHz-800MHz band, and there are five smaller antennas located in the middle of the large four that cover 800Mhz to 2.5GHz:
The design of the low-frequency elements seems to have evolved between the 2009 configuration and the final product. On one figure, it has only nine dipoles, contrary to the thirteen of the flight model:
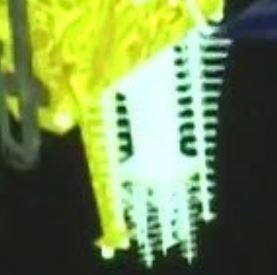
Since my estimate was based on the low-frequency antennas only, I should have found a range of 200MHz-800MHz, not the 250MHz-1.5Ghz I found. This could be because the design has changed after 2009, or more likely because it is hard to estimate the highest frequency by measuring the length of a dipole element that is only a few pixels wide in the picture. The result will vary a lot if the measurement is off by one pixel, whereas for low frequencies the dipoles span dozens of pixels in the image, so being off by one pixel does not change the computed frequency too much.
Overall, this paper validates that using log-periodic antennas on a satellite is a tell-tale sign of a signal intelligence application, and that the frequency ranges estimates by measuring the antennas in the pictures are accurate as long as the antenna elements are much larger than a pixel. The only thing now missing to get a complete picture of TJS-4’s abilities is accurate data on its deployable reflector.
Appendix
The research paper:
And a google OCRed and translated version:
1 Introduction
In a space-borne system, a wide-band feed source is required as an illuminator to build a reflective surface antenna. The antenna forms multiple beams to cover the ground in a specific manner, and completes the function of collecting ground wave signals and locating source targets. In order to form a multi-beam, multiple units are required to illuminate the reflecting surface; at the same time, in order to create a signal reception from the ultra-short-wave radio to the cellular communication band (0.2-2.5 GHz), the unit’s operating band is required to be wide. Therefore, we decided to use a log-periodic antenna (LP | DA) array to build the feed. LPIDA, as a non-rebellion antenna, has the advantages of operating frequency bandwidth, simple structure, and stable gain. It is also easy to implement on-board in technology. Unlike ordinary antenna arrays, this LPDA array does not synthesize the pattern of all units to achieve a very high gain.In fact, each unit works independently of each other.
Therefore, in the design, in addition to considering the electrical characteristics of the unit itself, the actual performance of the unit under the mutual influence of the component needs to be analyzed. At the same time, the array is used in the space environment, and it has high requirements on indicators such as weight and strength. Therefore, it is also very different from common LPDA arrays in terms of materials, processes and structures.
2 Design method
2.1 Unit design
LPDA is composed of N parallel dipoles (i.e. oscillators) arranged in a certain proportional relationship.
A pair of two-wire transmission lines (i.e., collective lines) cross the micro-electricity; when it is in the operating frequency band, the oscillator (L ≈ λ / 2) corresponding to the wavelength forms an effective radiation area, and the reflection area and the direction area are formed before and after The antenna’s forward gain is basically balanced in a wide frequency band, and the impedance characteristics are good.
The structural parameters of the LPDA are defined as follows: proportional constant–“Yes, spacing factor. Yes-(1-risearco The choice is related to the gain of the LPDA, which can be determined by checking the engineering ascent curve based on the design index. The spy decided.
The antenna array works at 0.2-2.5 GHz, requiring a gain of 6.5 dB per unit, an anodized axial ratio of 4 dB or less, and a standing wave ratio of greater than 2. According to the beam distribution requirements, the array unit is divided into 0.2-0.8 GHz (low frequency unit) , 0.8-2.5 GHz (high slurry unit) two. The unit uses two single-stage LPDAs arranged orthogonally.
In the electrical line, a broadband 90 ° bridge composite signal is used to achieve dual circular polarization. considering
There will be a certain loss in single performance after arraying. The design gain of single-polarized LPDA is greater than or equal to 9.5. The specific antenna design parameters are shown in Table 1.
The impedance matching between the antenna and the wire has a great influence on the radiation efficiency of the antenna. The LPDA input impedance has the following relationship with its structure: the characteristic impedance of the potential damper Z-120 (love -2 25), the collective line reactance-120 In pyd + (DVty-mountain, antenna input impedance
2y = Z- 1 + where D is the pitch of the collective line, the diameter of the collective line, and Up is the ratio of the length and diameter of the radiating element.
The above design is based on a unipolar UPDA. When two unipolar LPDAs are orthogonally combined, the mutual influence between the two will make the matching performance worse. Therefore, it is necessary to modify each structural parameter under the previous design. Because the outline size of the collection line and the radiation probe has been selected due to the limitation of the processing technology of the carbon fiber material, the impedance matching can only be performed by adjusting the spacing of the collection lines.
In addition to electrical performance, spaceborne antennas also need to consider spring weight, strength, environmental adaptability, system reliability and other indicators, and their dimensions are often subject to control. Therefore, the actual design of the unit has the following characteristics:
(1) Use hollow fiber composite materials to make hollow LPLOA assembly lines and radiation probes, and use titanium alloy fasteners to assemble, light weight and high strength; in the case of loss of a certain antenna gain, in order to reduce the lateral size of the array, The low-frequency LPDA’s four long symmetrical oscillators are loaded in the longitudinal direction; in order to meet the structural strength requirements, the connection between the stroker and the assembly line must have a good support surface, so a rectangular assembly line is used, and a fast shape Convenient and precise adjustment of distance, as shown in Figure 2.
2 Schematic illustration of the antenna cross section (2) The measured resistance of the carbon fiber antenna component is about 10 to 20 a. In order to reduce the surface current loss, metallization is required. The metal layer of the telex method was too thin at first, only a few microns, and the resistance The actual measurement is still 1-50, and the phenomenon of spalling occurs under temperature shock. As a result, the surface is hot-pressed, and the component is goldenized.The measured resistance meter is 0.
Around 00, it still maintains good appearance and conductivity after the temperature shock test.
(3) In order to meet the requirements of wideband circular polarization, 90-band analysis with a bandwidth of about 4: 1 (200 ~ 800 MHz, 800-2 500 MHz) is required. For this purpose, the gradient electrolysis of the dielectric strip line is specially designed and processed, as shown in Figure 3.
D3 dielectric price Greek transformer bridge
The measured phase stability of the electric bridge in the operating frequency band is within 90 ° ± 3%, and the amplitude consistency is within ± 0.5 dB. It is manufactured using a special process to meet the requirements of the space environment. 2.2 Array Design
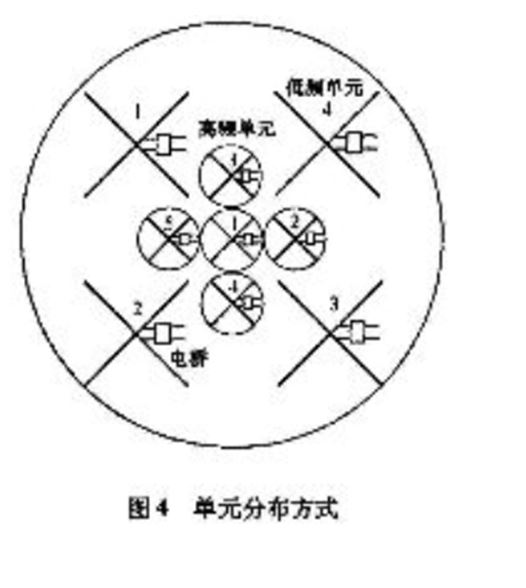
The antenna array consists of 4 low-frequency units and 5 high-frequency units, and each unit works independently. According to the beam distribution requirements of the pattern, the layout of Figure 4 is adopted: the high-frequency units are symmetrically distributed in the cross, and the low-frequency units are symmetrically divided.
Distributed around the high-frequency unit. Due to the limited horizontal size, the cell spacing is very small.
The distance is about 0.2λ.
Figure 4 Unit distribution
The array can be connected to two arrays, high and low, and the horizontal distance between the units. In a limited space, the relative position of the two arrays has a significant impact on the performance of the store. If all the bullets are fixed on the floor, the array car has a low core and good anti-vibration performance, but the high-ranking sub-array is almost completely blocked by the lower array, and the high-frequency unit has poor electrical performance. Stabilizing the child at the top eases the interaction between the sub-arrays. However, the array or the heart is elevated, and the anti-vibration performance is deteriorated. Therefore, only the electrical and mechanical properties are folded and placed in the middle position towards the Weizi array. The reinforcement of the array uses two layers of fresh-sand sandwich panels to connect the units to each other.
The structure is shown in Figure 5.
5 Antenna array design structure
3 Simulation and implementation
3.1 Unit simulation and optimization
The design of LPDAs is often based on theoretical and empirical formulas, and the actual product calibration is usually performed by spectrum tests. The antenna assembly is processed and formed once from the environment, and then enters the vacuum tank for batching. The processing cost is very high, and it cannot be debugged after assembly. Therefore, it is particularly important to verify the reliability of the design. Here, the German ST company’s Microwave Studio (MWS) electromagnetic computing software package is used for simulation. It uses the Finite Integration method (Finite Integration), and uses discrete Fourier transform for the time-domain imitation number.It can calculate the heat of the entire wide band like a single calculation.The solid modeling is based on the ACIS modeling kernel and the structure is controlled. Process, and modularize each part, can define physical parameters and electrical characteristics, so the simulation model can more accurately simulate the real object and the ring |. In addition, the multi-level subnet (MSS) technology used by the software can greatly To improve Gang Cang’s efficiency and accuracy, the simulation results are closer to reality.
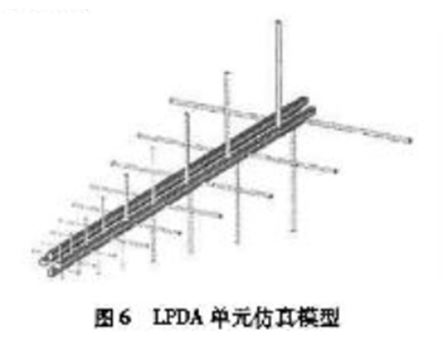
For the LPDA unit, perform MWS modeling of the high and low unit distribution according to the aforementioned design parameters, as shown in Figure 6. Taking into account the working class rate, in the short-wave and microwave frequency bands, the current is mainly concentrated on the conductor surface. The connection line and oscillator are defined as solid copper rods, and the copper radiation space is
From space, the electric door is the enemy (Discrete Port), making the electric impedance 50 Ω.
96 LPDATIN MWS uses finite integration method for simulation operation. The mesh in the simulation area is hexahedron. The specific division has a direct impact on the calculation margin and accuracy. By default, the software can automatically divide the mesh according to the model structure. At the same time, three setting parameters are provided for engineers to manually divide the mesh: the ratio of Abbe’s side length to the minimum working length (Lines per wavelength), ASR (Lower mesh limit). * Mesh line ratio limit. To obtain calculation accuracy and calculation time,
Manual meshing is performed at the current sudden change, and the other parts adopt the default settings.
It has been pointed out earlier that the gain of LPDA has been determined by TV, and the engineering is very mature.
However, the electrical matching of the LPHA unit must not be determined. Since the distance between the collective lines has a key influence on its standing wave performance, the simulation uses the collective line spacing as an optimization variable, and within a certain value interval, with the constraint of its own parameter Sin, using the software’s automatic optimizer (Optimizer) function. The optimal value is obtained through multiple generations of calculation. After the spacing of the incoming lines is determined, the basic structure of the LPDA unit is also determined.
3.2 Cohort Simulation and Optimization
After the electric drill and optimization of the unit are determined, the array design can be performed according to the engineering requirements. Due to the special array formation method, the number of oscillators, and the complicated boundary conditions, the theoretical analysis and moment method calculation are used to investigate the elements in the array. Electrical performance is very difficult. In order to simulate and optimize the array design, it is a more economical and practical method to use electromagnetic field simulation software. The model was established using the MWS software package, and the parameter settings were the same as the unit simulation.
After the array is formed, the performance of the high and low units is mutually restricted, and it is difficult for automatic optimization to converge to a suitable value.At the same time, it was pointed out that the lateral spacing of the units cannot be enlarged due to structural restrictions. The relative position A of the base of the low-frequency sub-array is a variable, and it is scanned at a certain interval in a given interval. The simulation results under different values are compared, and the structural strength test circle is integrated. Finally, a more appropriate value is selected to determine the component mode. Calculate the corresponding antenna pattern and gain value.
3.3 Simulation and measured results
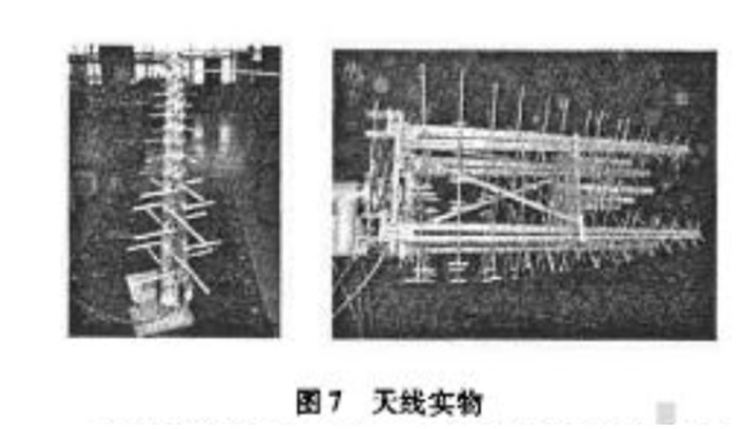
According to the optimized antenna structure after simulation design, the actual processing of antenna elements and arrays is shown in Figure 1.
The antennas are shown in Figures. Figures 8, 9, Tables 2 and 3 show the results of the independent unit and the rear unit in the anechoic chamber.
| One Truth
Figure 8 Unit standing wave ratio
(e) In unit HHs
Figure 9 The direction of the unit in the array (the actual combat is the simulation value, and the direct practice is the test value)
Table 2 Unit gain | Hotspot / AMHz | 200 800 * 800-12 5300) | Independent body pull (emulation 19.5 19.0 | 10.
09.4 | Independent gain (figure) -dB 192 9.3] 9.8 | 9.11 Intra-quotient gain simulation 3dB 17.114.7 16.8] 8.1 Saan gain (measured 5: dB | 6.7 18.6 6.6 | 8.0 | Note: indicates low power consumption unit: * indicates HF unit
Table 3 Unit draw ratio Analog point HH: 0 80000 2500 Health vertical axis ratio (simulation 3/15 1.6 1.5 1.6 | | Liaby ratio (US). DB 12.
11.9 2.0 | 1.9 | Sane ratio (simulation-dB 13.8 2.5 3.7 2.5 | Sane ratio (planning 3rds 14.0 3.0 14.
03.1 Note: The string indicates a sexually transmitted disease unit.
This book indicates that the access unit can be seen from the top to the diagram. Using WMS simulation to aid design, the results obtained are in good agreement with real values, and the performance of the actual array has reached the design index.
The standing wave ratio curve is based on the ideal state due to the simulation model. The actual objects are affected by processing accuracy and test environment, so they are not the same, but the trend of the curve is basically the same throughout the severe section. As can be seen from the comparison in the figure, the consistency of the directional pattern in the host range is good, and the differences to avoid are mainly the processing accuracy of the antenna itself (the symmetry is not as good as the simulation model) and the influence of the test environment. In terms of gain value, the error is within 0.4dB. The circular polarization axis ratio is not as good as the model due to physical symmetry. The signal amplitude and phase consistency of the two orthogonal channels are worse than the model, which affects the synthesis of the circular polarization signal and makes the test value ratio simulation. The value is about 0.5 dB larger.
4 Conclusion
From the actual measurement results, it can be seen that due to the influence of mutual cotton after the array is formed, the gain value and the axial ratio value are reduced by about 1dB compared to the single control operation. Especially for the low operating point of the unit, due to the small band spacing, the mutual influence is greater , Resulting in a further drop of about 2dB. In this regard, we have sufficient margin in the design of independent units. The unit performance after the shoots still reached the design requirements.
During the development of the array, computer-aided means were used to optimize the design in advance, without processing and debugging samples, saving development time and costs. At the same time, the array is used for spaceborne platforms, and some new attempts have been made in terms of materials, processes and structures. The actual array weight is only about 25kg, and the environmental adaptability has reached the aerospace index. The final results show that the design and implementation of the array are successful and have certain reference value for the design of similar projects in the future.

[…] After the publication of this article I came across a Chinese research article on TJS-4. See TJS-4 antenna design documents uncovered to know how accurate my predictions […]
LikeLike
I’m curious as to your thoughts about the potential beam pattern of the receiving antennas on the satellite. The article describes in great detail the technical aspects of using a wideband LPDA, but in a geosynchronous orbit the relatively low gain of the array would be focused on a fixed area unless it was mechanically or electrically steerable.
Do you suspect the focus pattern of the array is steerable in order to increase its coverage area, and based on its orbital position do you have any predictions about what is in the coverage path?
Great prediction on your part!
LikeLike
Thanks! I think the coverage can be steered by rotating the large parabolic reflector, however that will only permit a slow scan because it’s not very rigid.
LikeLike
Hi and thanks for the excellent article.
How would you visualize the deployed reflector vs the log periodic feed?
LikeLike